


Thousands of M&A deals take place each year, reflecting economic trends and business strategies. Analyzing M&A activity data — including deal volume, sector performance, and valuation trends — helps dealmakers make informed business decisions.
In this piece, we explore critical M&A statistics and sectoral shifts and offer projections to help dealmakers navigate their business landscape.
Importance of M&A Data and Key Insights
Examples of M&A data include the number of deals, their values, the industries and regions involved, and the outcomes of past transactions.
This data provides critical insight into how companies buy, sell, and consolidate. It helps stakeholders assess growth strategies and understand an organization’s past and potential future transactions.
Analyzing M&A data also allows business leaders to evaluate the financial impact of deals (e.g. effects on revenue, profitability, cash flow) and identify where synergies or risks might arise.
Companies use M&A data to drive strategic planning. For instance, by examining deal trends, a firm can decide when the market is ripe for an acquisition or if valuations are too high. Data on past deals helps in due diligence - understanding how similar acquisitions performed using verified deal data can shape the expected benefits of a new deal.
M&A activity has an enormous scale and has fluctuated with economic cycles. Over 790,000 transactions have been announced since 2000, worth over $57T cumulatively

Source: IMAA Institute
Activity tends to mirror broader economic conditions, growing in bullish market periods and dipping during downturns.
The data shows a cyclical pattern with a major spike in activity in 2021 (a banner year for M&A), followed by a “hangover” effect in 2022 as deal volume and value dropped off significantly. This indicates that 2021’s frenetic deal pace was unsustainable amid tightening economic conditions.
The recent downturn (2022–2023) can be interpreted as a market reset, where higher interest rates and economic uncertainty made dealmakers more cautious.
Financials and Real Estate dominate M&A activity, with 290,630 deals recorded, significantly outpacing other industries. This sector has shown a consistent upward trend, peaking at 20,145 deals in 2021, before declining in 2022–2023 due to economic uncertainty and higher interest rates.

Source: BCG
The Technology, Media, and Telecommunications (TMT) sector follows with 114,443 deals. It enjoyed growth between 2010 and 2021, fueled by digital transformation, software consolidation, and telecom mergers. The government sector remains the smallest, reflecting fewer but highly strategic transactions.
Overall, M&A activity varies significantly by industry, with financial services and technology leading in volume while cyclical industries experience more volatility.
Yearly M&A Activity Statistics
Tracking M&A data year over year can reveal useful insights, such as which sectors have experienced a rise in deals, or what kind of external events shaped deal sizes in a particular year.
M&A Activity by Year
Global M&A activity has varied year by year, especially in the past 5 years. Below is a summary of recent yearly trends:
2019: A robust year for M&A with global deal value around the mid-$3T range (a typical pre-pandemic level). This was a healthy year but not a record, reflecting stable economic growth.
2020: Marked by the COVID-19 pandemic, M&A activity initially slowed sharply. Global deal value ended around ~$3.6T — a modest increase in value from 2019 only because deal-making rebounded in late 2020. The year saw a dip in deal count due to lockdowns and uncertainty, but an improving fourth quarter set the stage for the next year.
Source: Kroll
2021: Record-breaking year — about $5.9–6T in deals worldwide, a 64% jump from 2020. This was the highest annual M&A value since records began in 1980. Contributing factors were low interest rates, abundant liquidity, and companies using M&A to reposition after the pandemic. Notably, large “mega-deals” (>$10B) increased significantly, and the boom included many mid-sized deals as well.
2022: Sharp decline from the 2021 peak. Global M&A totaled roughly $3.6T, down about one-third. The first half of 2022 was strong, but dealmaking plummeted in the second half as interest rates rose and economic uncertainty grew.

Source: MOFO
2023: A further drop to around $3.2T globally, the lowest in 10 years. That’s about a 15% decline in value versus 2022. Higher financing costs, valuation gaps between buyers and sellers, and recession fears kept many deals on hold. Deal volume (number of deals) also fell around 7% globally. Despite this, some regions (notably the US) and sectors (energy, certain healthcare deals) showed resilience even as overall totals were down.
2024: The surge in high-value deals indicates that the M&A recovery might be already underway. The number of deals over $1B rose by 17% in 2024, along with an increase in their average value. However, smaller and mid-sized deal activity declined by 18%, signaling a more cautious approach in that segment.
Top M&A Sectors by Year
Over the past few years, technology deals went from boom to relative bust. After dominating 2020–2021, tech M&A slowed in 2022–2023 due to market saturation and stricter antitrust review. In contrast, the energy sector saw a resurgence by 2023 as oil companies deployed cash for strategic acquisitions.

Source: Statista
Healthcare/pharma has remained consistently in the top tiers each year. The trend was often driven by pharma companies acquiring biotech innovators, such as 2023’s Pfizer–Seagen deal.
Another trend is the role of financial sponsors: private equity-driven deals (spanning various sectors) have been significant. In 2022, they were very active in tech and software take-privates, and in 2023 sponsors still comprised ~20% of M&A value despite a slowdown.
Looking at sector share by year, one can say Tech peaked in influence in 2021, Energy and resources rose in 2023, and Healthcare continues to be a steady contributor.
The sector rotation also suggests that when one sector’s activity cools (e.g. Tech), others (like Energy or Industrials) may pick up, keeping overall M&A diversified across the economy.
Trends and Predictions in M&A
Recent M&A data reveals several important trends. First, there has been a cooling of mega-deals in certain high-growth sectors and a rise in strategic deals in others.

Source: Kroll
For example, in 2023 technology deal-making “cratered” relative to prior years, while activity in healthcare/life sciences and energy rebounded.
Another trend is the dominance of large-market deals by the US. The Americas (especially North America) have maintained or even increased their share of global M&A. In 2023, the Americas held steady while Europe and Asia saw sharper declines.
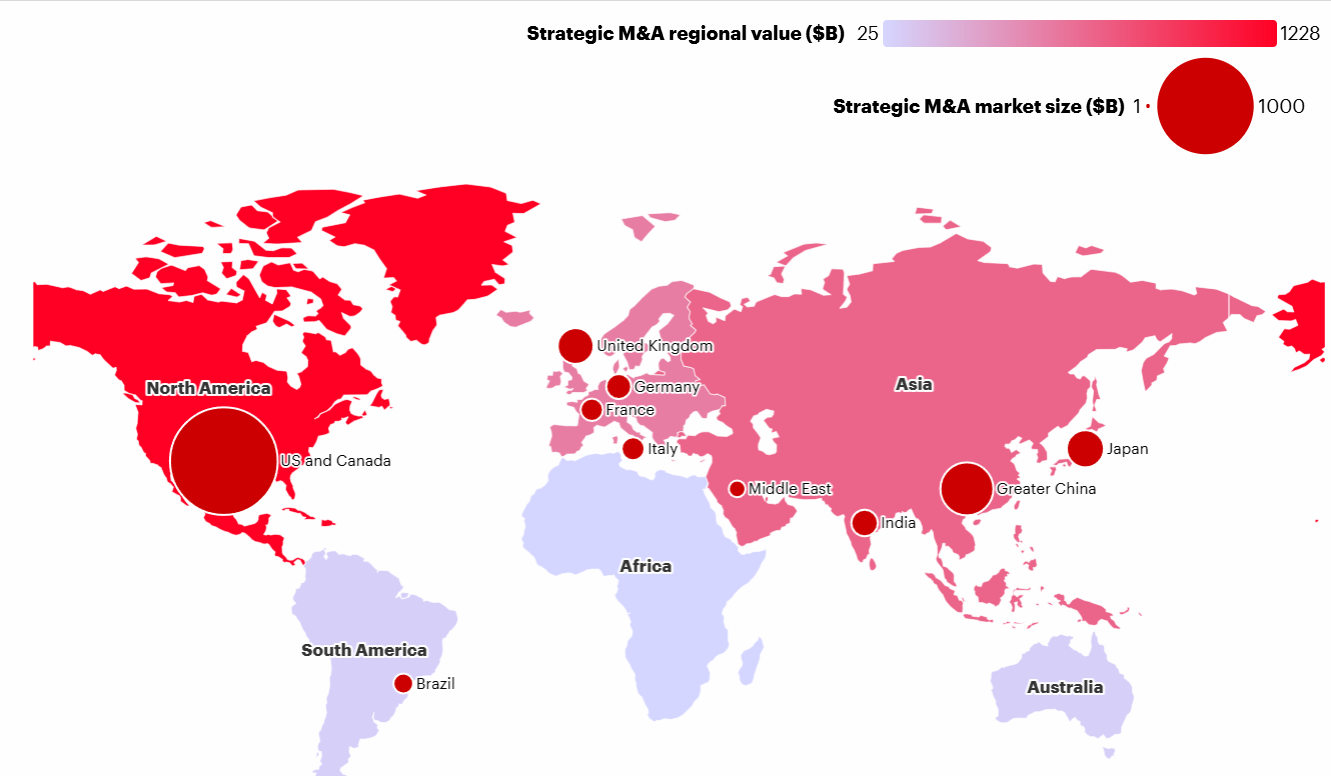
Source: Bain & Company
The M&A recovery has been uneven geographically, with the US rebounding faster and Europe and Asia lagging.
Another emerging trend is the increasing complexity and length of deal processes in the current environment. Due to regulatory scrutiny (antitrust reviews, national security concerns) and valuation gaps between buyers and sellers, deals take longer to close and require more creative structuring.
Analysts forecast technology M&A to rebound from its slump, though perhaps not to previous highs. Interest in areas like AI, cloud, and semiconductors could drive new deals.
Energy and industrials are predicted to stay active, continuing the consolidation trend as companies transition portfolios for the future.
Regions like Europe may see a larger uptick if economic sentiment improves, and emerging markets (e.g. India, the Middle East) are on the radar for more cross-border acquisitions.
One clear trend looking forward is the increasing role of strategic M&A for transformation. Even in slower markets, companies are using M&A to reposition in fast-changing industries. For example, automakers buying EV battery technology firms, or traditional banks acquiring fintech startups.

Source: Consultancy
Another expectation is that deal structures will become more creative. We may see more joint ventures, minority investments, and spin-offs as alternatives to full takeovers, especially if financing large deals remains expensive.
Many observers predict a return to growth in M&A activity in the next 1–2 years, barring any new economic shocks. Business leaders are advised to watch regional indicators (like credit conditions in the US vs. Europe) and sector signals (such as tech valuation resets) to time their next moves. The consensus is that M&A will remain a key growth tool globally, and those prepared to act quickly as the market turns will benefit the most.
Notable M&A Deals in Recent Years
Several high-profile mergers and acquisitions in the last few years grabbed headlines, either for their size or strategic significance. Below is a list of big M&A deals, organized by year, from 2021 through 2024:
- 2021:
- AT&T’s WarnerMedia and Discovery, Inc. (Media) — $43B. This deal merged WarnerMedia’s vast content library (HBO, Warner Bros.) with Discovery’s networks, creating a new media giant (Warner Bros. Discovery) to compete in streaming.
- Grab Holdings and Altimeter (SPAC deal) — $40B. Southeast Asian ride-hailing and delivery company Grab went public via a merger with Altimeter’s SPAC, one of the largest SPAC deals on record.
- Canadian Pacific Railway and Kansas City Southern (Transportation) — $31B. A blockbuster North American railroad merger connecting Canada, US, and Mexico — first major railway M&A in decades, completed in 2023 after regulatory approval.
- 2022:
- Microsoft acquisition of Activision Blizzard (Technology/Gaming) — $68.7B. This was the largest announced deal of 2022 globally. Microsoft aimed to buy video game giant Activision to bolster its Xbox and gaming content portfolio. The deal faced prolonged regulatory reviews and ultimately closed in late 2023.
- Broadcom acquisition of VMware (Technology) — $61B. Chipmaker Broadcom’s bold move to acquire cloud software firm VMware was one of the year’s biggest tech deals. It was closed in 2023 after regulatory delays.
- AMD acquisition of Xilinx (Semiconductors) — $35B. Advanced Micro Devices (AMD) bought FPGA-chip maker Xilinx in a large all-stock deal to expand its semiconductor product lineup.
- 2023:
- ExxonMobil acquisition of Pioneer Natural Resources (Energy) — $60B. ExxonMobil’s mega-deal to buy Pioneer, a leading shale oil & gas producer in Texas, was the largest oil & gas acquisition in years and the biggest deal of 2023. The deal significantly expanded Exxon’s shale assets.
- Pfizer acquisition of Seagen (Healthcare/Biotech) — $43B. Pharma giant Pfizer agreed to acquire Seagen, a biotech specializing in cancer therapies, marking one of the largest pharmaceutical M&As of 2023. This deal, aimed at expanding Pfizer’s oncology portfolio, was a highlight in a strong year for healthcare M&A.
- KKR acquisition of Telecom Italia’s network (Telecom) — $23 billion. Investment firm KKR and others agreed to buy a controlling stake in Telecom Italia’s fixed-line network, one of Europe’s largest telecom transactions of the year.
- 2024:
- Mars Inc. acquisition of Kellanova (Consumer Goods) — $30B. Mars Inc. expanded its product portfolio by acquiring Kellanova (formerly Kellogg Company), a major move in the food industry consolidating snack and cereal brands.
- Novo Holdings A/S acquisition of Catalent (Pharmaceuticals) — $16.5B. Novo Holdings acquired Catalent, a leading provider of drug development and delivery technologies, boosting its pharmaceutical manufacturing capabilities.
- Blackstone acquisition of Tricon Residential (Real Estate) — $3.5B. Blackstone expanded its residential real estate portfolio with the acquisition of Canadian housing company Tricon Residential, reinforcing its investment in rental properties.
These deals underscore key themes in recent years: 2021 was dominated by media and tech consolidation, 2022 featured landmark tech acquisitions, and 2023 saw a return of mega-deals in energy and healthcare.
Each year’s notable deals also reflect the economic context, e.g., high oil prices in 2023 driving oil mergers, or low interest rates in 2021 enabling highly leveraged tech deals.
M&A Data Tools and Resources
Various tools and platforms provide M&A data with continuously updated information. Below are some of the top tools and resources for M&A data and insights:
- Grata — Grata is a powerful, end-to-end dealmaking platform built for M&A professionals, investment bankers, and private equity firms. The platform helps users conduct in-depth industry research, monitor private company activity, understand acquisition trends in any market, and identify potential acquisition targets. With investment-grade data, precedent transactions, public and private comps, proprietary AI Search, easy-to-use filters, live deals, and more, Grata simplifies the entire dealmaking process for the private market.
- Bloomberg M&A — Bloomberg Terminal is a gold-standard for real-time financial data, including a robust M&A database. It provides up-to-the-minute deal announcements, volumes, and the ability to screen for deals by size, industry, region, etc. Bloomberg’s league tables and M&A news coverage are widely used by investment bankers and analysts.
- Refinitiv (Thomson Reuters) / SDC Platinum — Refinitiv, now part of LSEG, maintains one of the most comprehensive global M&A databases (previously Thomson Reuters SDC). It tracks announced deals worldwide and is the source of many published M&A statistics. Refinitiv’s deals intelligence portal provides data on deal values, counts, and trends, and it powers league tables for advisors.
- Institute for Mergers, Acquisitions and Alliances (IMAA) — The IMAA provides free access (with registration) to a range of M&A statistics and data visualizations. Their site has regularly updated figures on global and regional M&A volume and value, and even breakdowns by industry. It’s a useful resource for high-level stats and historical trends without a pricey subscription.
- Statista — Statista compiles key M&A stats and infographics sourced from financial databases and reports. For example, Statista has charts for the value of global M&A deals by year, by region, by industry, etc., which can be handy for quick reference. While not a real-time tool, it’s a good source for vetted figures and comparisons.
Staying informed through these resources can help business leaders and investors spot opportunities and benchmark against M&A market activity.